

Digital bond · News
Spain's worst PISA results in 25 years: what PISA 2025 says about screens and digital devices in the classroom
September 10, 2026 · 7 min read
Spain reaches, in PISA 2025, some of the lowest nominal scores in its historical series, with statistically significant drops in Reading and Mathematics, while the report once again measures classroom distraction from digital devices, this time in Science. This article reviews the data instead of repeating the headline — it verifies it.
Spain has just reached, in the OECD’s PISA 2025 report, some of the lowest nominal scores in its historical series — the OECD itself speaks of results “among the lowest ever observed in Spain” —: 477 points in Science, 451 in Reading and 457 in Mathematics. All three average scores are lower than in 2022, although in Science that difference is not statistically significant — the clear and statistically significant drop is in Reading and Mathematics. The Spanish decline does not come out of nowhere: the results already showed a weakening trend, especially since 2015, even though in 2022 Spain was, overall, close to the OECD average. Since 2015, the country has lost 45 points in Reading and close to 30 in Mathematics. As a rough reference, the OECD uses twenty points as an approximate benchmark for one year of educational progress at that age — it is not a mechanical conversion, but it helps gauge the scale: the 45-point drop in Reading since 2015 is more than twice that reference.
This figure circulated for days as an alarming headline. We prefer to do what we have been doing since this outlet’s first article: not repeat it, verify it.
What the OECD has already measured, with data, not intuition
The report itself offers a concrete clue about one of the factors associated with performance: 28% of students across OECD countries say their classmates — not themselves — get distracted using digital devices in most or all Science classes — in Spain it is 29% — and that distraction is associated with worse performance in more than two-thirds of the education systems assessed. The OECD speaks of association, not causation: the study’s design does not allow it to establish that digital distraction is the cause of worse performance, and the OECD itself flags possible alternative explanations.
Between 2022 and 2025, the proportion of students who spend more than an hour browsing social media increases, while participation in creative digital activities and practical information searches declines — a shift in usage pattern, not proof that most social media use is passive.
In Spain, this group scores 16 points lower in Science after the socioeconomic adjustment the OECD applies in its own model — different, it should be said, from the specific ESCS-level adjustment used in the independent microdata analysis presented further below.
This is not a moral hunch about “young people and screens.” It is a measured pattern, with public methodology, replicable by anyone who downloads the microdata straight from the OECD.
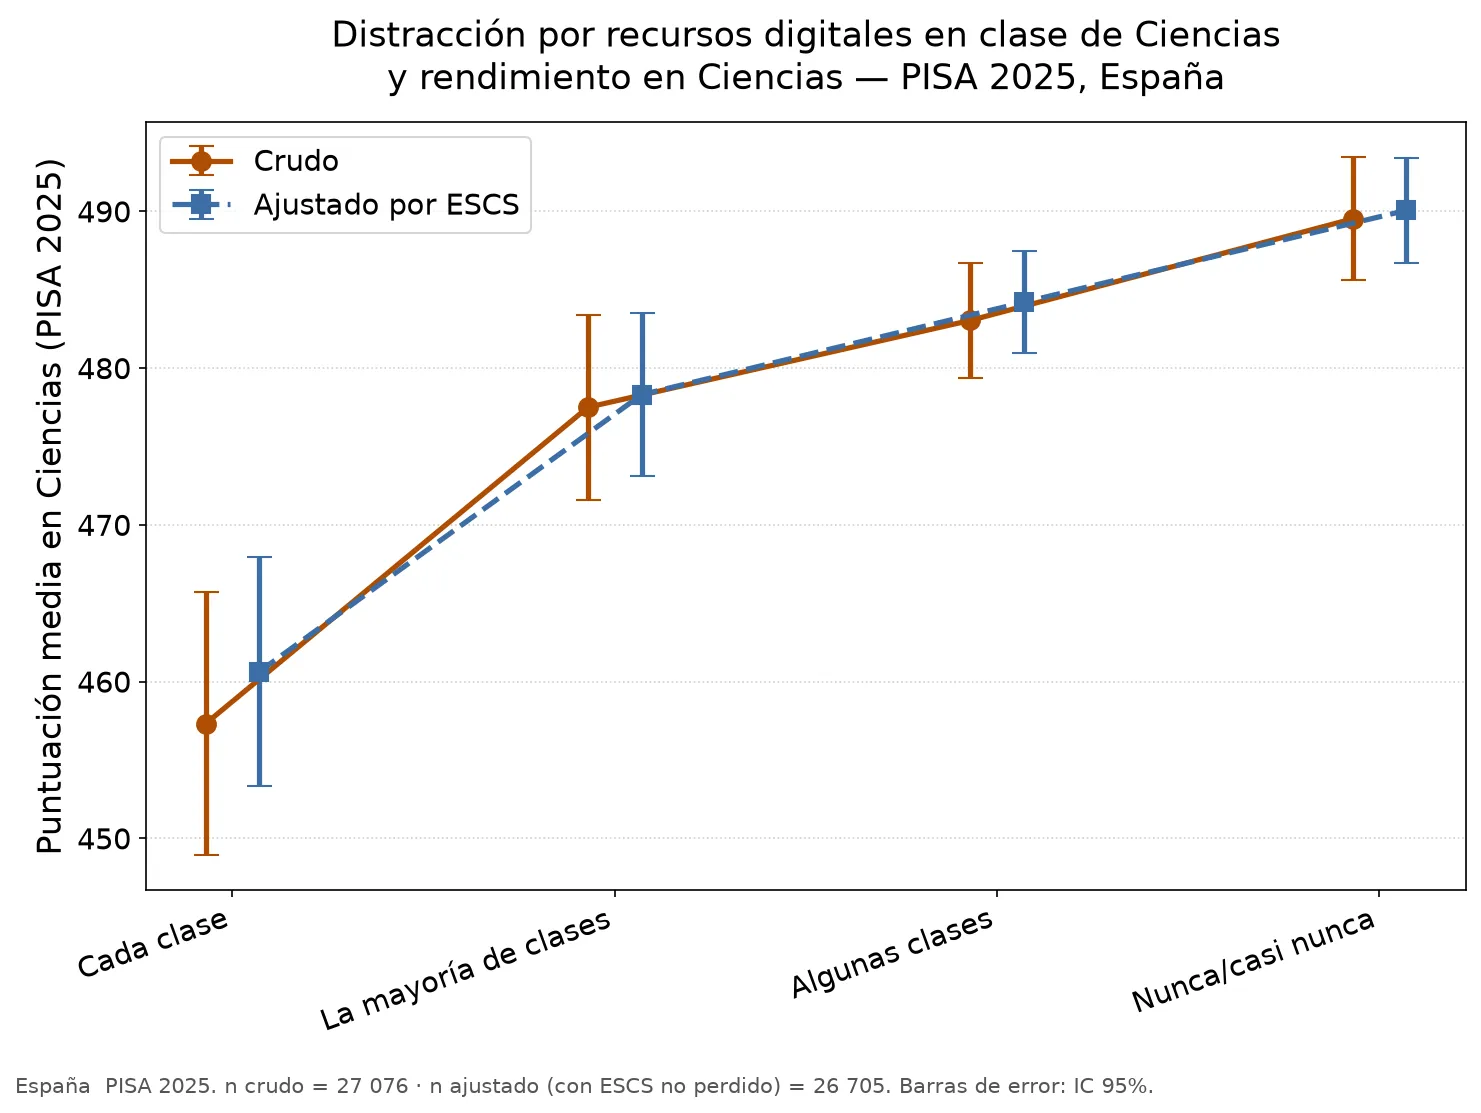
Independent analysis of PISA 2025 public microdata (not of the official report): the lower the perceived distraction in Science class, the better the average score, both in raw data and in data adjusted for the family’s socioeconomic-cultural level (separate lines). The vertical bars mark the 95% confidence interval for each point — these are not exact figures without margin, but estimates with uncertainty — and the sample is large (more than 26,000 Spanish students in each version of the calculation). The estimated averages follow a monotonic pattern across all segments, but measuring this association does not turn digital distraction into the demonstrated cause of performance — that nuance is explained above. Source: independent analysis by labs.tever.es based on the OECD’s public microdata file.
What’s actually worth scrutinising before repeating a headline
The Spanish decline is not an isolated phenomenon, but it is also not as linear as some headlines suggested: in 2022 Spain was, overall, close to the OECD average across all three competencies — not below average in all three, as was claimed on occasion. The real weakening trend predates this and is especially visible since 2015, and much of Western Europe is retreating in this same cycle. It is worth not confusing “Spain is falling” with “the whole world is collapsing the same way”: these are related but not identical phenomena, and some headlines skipped that nuance to sell more alarm than the data itself supports.
The sample exclusion almost no one explained properly
There is a second finding, less cited in general coverage, that demands the same discipline we apply to any data we handle in this outlet: Catalonia had an official exclusion rate of 23.2%; 591 students were left out of the test, more than four times the 5% technical standard. The official breakdown of the exclusion distinguishes three categories: 6 for physical disability, 493 for cognitive, behavioural or emotional disability, and 92 for insufficient command of the test language. According to later information on the incidence investigation — not part of the OECD’s main dataset — only 5 schools met the recommended 5% and about a dozen exceeded 40% exclusion.
The consequence is blunt: Catalan results should not be used for territorial or historical comparisons, with the OECD specifying that this data “only corresponds to those assessed, not to the student body as a whole.” The next ordinary cycle in which Catalonia could recover a comparable result is PISA 2029. Other regions with high exclusion also appear with caveats — Murcia (12.7%, with a caution note for possible upward bias) — and the Balearic Islands (7.5%), against Spain’s overall exclusion rate of 7.9%.
This matters here by direct contrast: Asturias has the highest score in Spain in Reading among regions with comparable results, with 471 points — twenty above the Spanish average — plus 492 in Science, 469 in Mathematics, and leading Environmental Science with 495 points. The methodological comparison matters: Asturias had an exclusion rate of 2.07% (1,798 students from 56 schools), within PISA standards, while the OECD considers that Catalonia’s 23.2% rate may bias its results upward.
(An honest nuance we don’t hide: Asturias also loses ground compared with 2022 — 26 points less in Reading, 26 less in Mathematics and 11 less in Science — so relative leadership coexists with a real absolute decline. Leading Spain is not the same as doing well on its own terms.)
Why we wrote this
We are not making this reading because an optimistic headline about Asturias suits us, nor to join the generic doom-mongering about “young people and their phones.” We are making it because we believe technology is neither good nor bad on its own — what matters is how, for what, and in what context it is used; and part of these differences can indeed be studied with data.
This report also mentions a specific finding on the use of generative artificial intelligence that deserves its own analysis — we’re not mixing it in here so as not to dilute it. We’ll cover it in the next piece of this series, with a twist you probably don’t expect: the OECD’s data does not support a simple rule of the “using AI = worse performance” kind.
If you don’t want to wait, there is already an independent analysis of PISA 2025’s own microdata (not the official report, but the public file the OECD publishes) that compares digital distraction with the frequency of AI chatbot use in school tasks — with results that don’t follow the simple pattern behind the “one school year” headline that circulated these past days —: “PISA 2025: AI and digital distraction, with data”, on labs.tever.es.
Sources
- OECD. PISA 2025 Results (Volume I) — Country Note: Spain. Spanish results, sample exclusion (Spain 7.9%, Catalonia 23.2%, Murcia 12.7%) and warning about the possible upward bias. https://www.oecd.org/en/publications/pisa-2025-results-volume-i-country-notes_2d4ff9ea-en/spain_748275c0-en.html
- OECD. PISA 2025 Results (Volume I): Future-Ready Students — chapter “Student performance in PISA 2025.” Source of the 28%/29% perceived distraction from digital resources and the 16-point socioeconomic adjustment in Spain. https://www.oecd.org/en/publications/pisa-2025-results-volume-i_73451bc5-en/full-report/student-performance-in-pisa-2025_23e075c2.html
- Principality of Asturias Department of Education / Educastur. Asturias’s results in PISA 2025. Source of the sample (1,798 students, 56 schools, 2.07% exclusion) and Asturian scores (471 in Reading, 492 in Science, 469 in Mathematics).
- ElNacional.cat. “Los resultados sesgados de Catalunya en PISA: la exclusión del 23% de los alumnos muestra una mejora irreal.” Journalistic source (not the OECD) for the school-by-school breakdown — only 5 met the recommended 5%, about a dozen above 40% exclusion. https://www.elnacional.cat/es/sociedad/resultados-sesgados-catalunya-en-pisa-exclusion-23-alumnos-muestra-mejora-irreal_1691995_102.html
- Tever, labs.tever.es. “PISA 2025: IA y distracción digital, con datos” (independent analysis of the public microdata). https://labs.tever.es/blog/pisa-2025-ia-y-distraccion-en-espana