

Digital bond · News
PISA 2025 and AI: knowing how much or what for isn't enough
September 19, 2026 · 7 min read
PISA 2025's public microdata (29,966 Spanish PUF records) show that the frequency of AI chatbot use across four different school tasks does not follow a simple pattern with the score. This article reviews the finding without forcing the conclusion to "what matters is judgement," and clarifies what the OECD actually says about the "school year" benchmark.
In the previous article of this series we saw that perceived distraction from digital resources in the classroom follows a clear pattern: the more distraction perceived, the worse the score, with no exceptions. With AI chatbots we expected to find something similar — a simple table of “good uses” and “bad uses.” That’s not what the data shows, and that is, precisely, the lesson of this piece.
The easy headline we decided not to repeat
There’s a figure going around that promises to settle the debate: using AI “well” in the classroom is equivalent to gaining a whole school year compared with using it “badly.” We’ve seen it cited dozens of times without anyone saying exactly where it comes from. Instead of repeating it, we went to the official report and to the public microdata.
Our sister outlet labs.tever.es downloaded the real PISA 2025 microdata: 29,966 Spanish PUF (public use file) records analysed, out of an official total of 29,967 students in 956 schools, the public file anyone can request directly from the OECD. The full result, with open code so anyone can reproduce it, is in their published analysis. Here we explain what they found and why it changes the question we should be asking.
One clear pattern, and one that isn’t
When distraction from digital devices in Science class is measured, the pattern is clean: the more distraction students perceive, the worse their average score — a difference of around 32 points between those who perceive constant distraction and those who never perceive it, a pattern that stays just as clear after accounting for the family’s socioeconomic level.
Not so with AI. PISA 2025’s questionnaire asks how often students use chatbots like ChatGPT for four different school tasks: summarising a text, searching for information, drafting an assignment, or “help me learn” in general. If the declared purpose and frequency were enough to separate more or less favourable uses for learning, we would expect considerably more systematic patterns across categories. That’s not what appears in the data: none of the four tasks follows a simple relationship with the score. For “summarising a text,” those who never use the chatbot have the highest average and those who use it daily have the lowest — but between those two extremes there’s a sharp drop at very occasional use, a rebound at monthly use, and another drop at weekly use before hitting the daily minimum. For “searching for information,” the highest average doesn’t belong to those who never use it, but to those who use it once or twice a week. Each task draws its own shape, and none is a straight line.
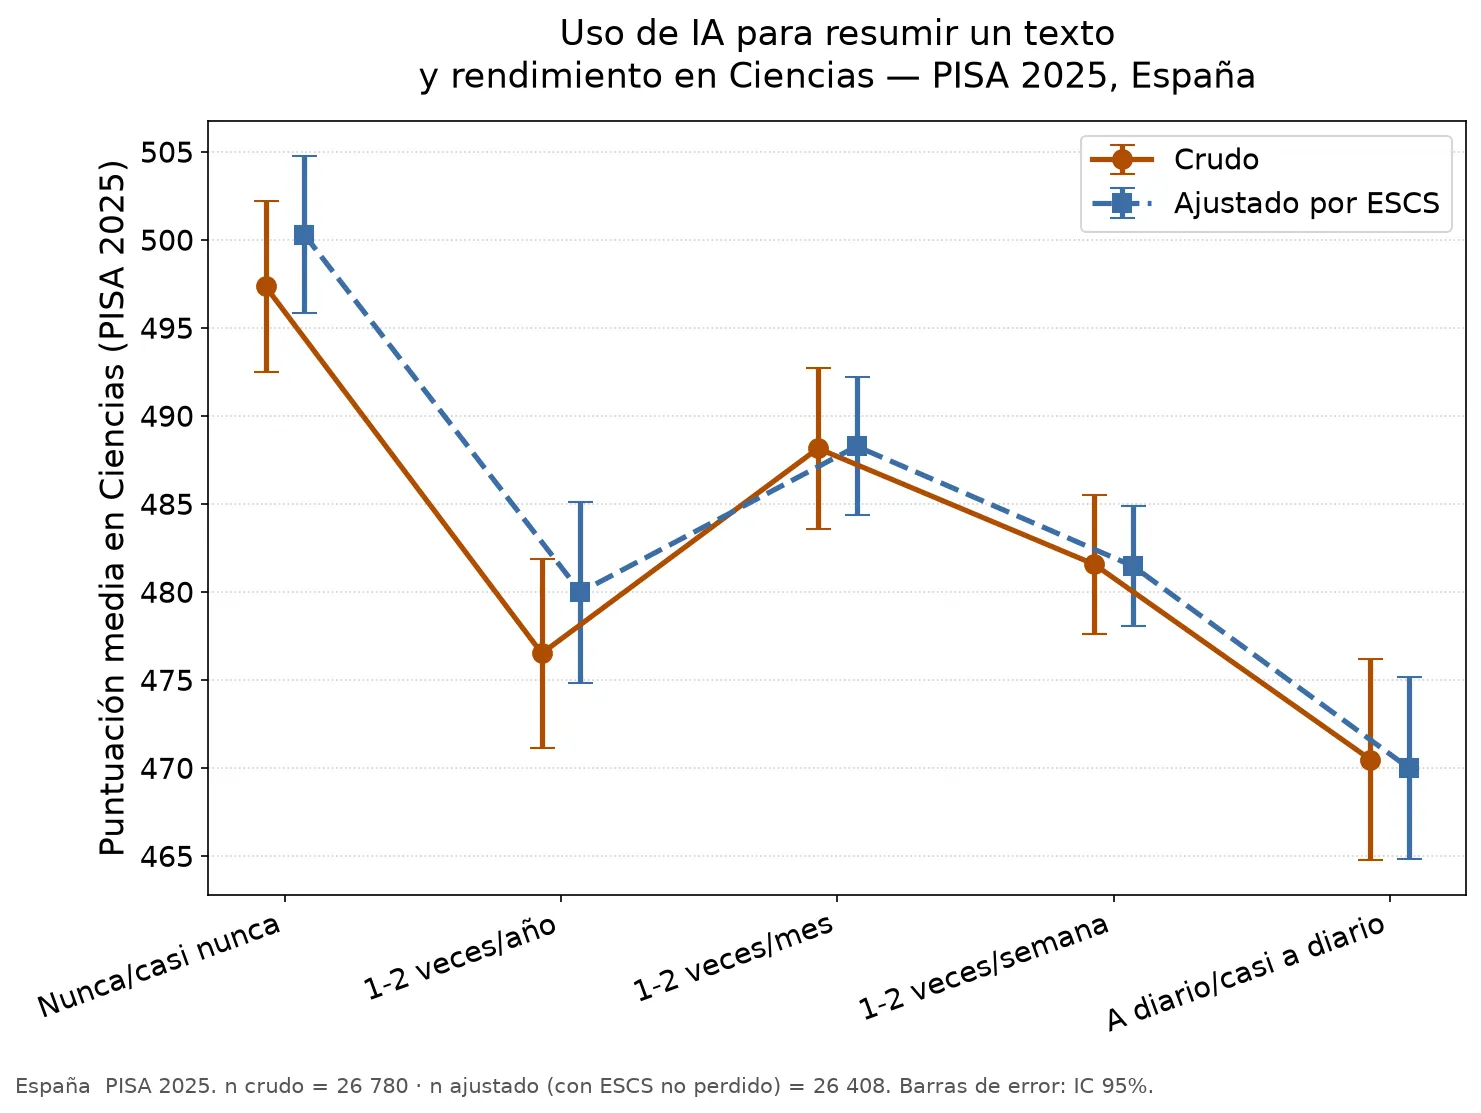
Independent analysis of PISA 2025 public microdata (not the official report): the “summarising a text” task best shows there is no simple pattern. It is not a line that drops (or rises) steadily — it has a sharp fall at very occasional use, a rebound at monthly use, another drop at weekly use, and its minimum at daily use. The differences between categories are descriptive; this chart does not statistically test each pair of frequencies. Also beware the possible reverse-causality bias (explained above): it describes an association at a single point in time, it does not prove what causes what. Source: independent analysis by labs.tever.es based on the OECD’s public microdata file.
Why this isn’t “it’s complicated and we don’t know”
It might seem like the conclusion is simply that the topic is confusing. It isn’t. It’s more precise than that: the four frequency items don’t measure the judgement with which AI is used — not depth, not supervision, not verification. They measure only frequency × declared purpose. The fact that the curves differ from one another doesn’t allow us to conclude that “judgement” is the variable explaining the difference: that’s our own editorial interpretation, not something the four items demonstrate on their own.
A knife is neither good nor bad in itself. It depends on who holds it and for what. No one expects a closed list of “good knife uses” and “bad knife uses” that settles the question once and for all — it depends on the judgement of the person using it, the context, the intent. The data is compatible with that idea applied to artificial intelligence in the classroom, but it doesn’t confirm it: PISA doesn’t prove technological neutrality nor identify judgement as the cause. What it does show is that frequency and declared purpose aren’t enough to sum up the relationship between AI use and performance in a simple pattern.
The labs.tever.es researcher himself sums it up with an honesty we share: “with this kind of data, taken at a single point in time, I can’t tell what’s the cause and what’s the consequence.” It could be that whoever uses the chatbot most to summarise texts is someone who was already struggling in class and seeking help, not the other way around. The questionnaire can’t distinguish that, and neither will we pretend that we can.
There is, however, an additional clue in the report itself that does point toward the “how.” The OECD studies whether students have opportunities at school to critically evaluate the quality of AI-generated information. Among students who report having those opportunities at school, those who use AI to learn once a week or more tend to score slightly higher than non-users and less frequent users — the OECD itself warns that this association does not allow causality to be established, but considers it compatible with the potential of specific teaching to reinforce critical AI use. The four frequency items don’t measure the judgement with which AI is used, but PISA itself offers this other clue: when it analyses school opportunities to critically evaluate AI-generated information, a different association appears. It doesn’t prove causality either, but it does suggest that counting uses isn’t enough: the context in which one learns to use it matters.
The viral figure, clarified
On the “full school year”: the source exists and it’s the OECD itself. In PISA 2025’s official summary it says that, for certain specific tasks (summarising, drafting, researching), non-users of AI outperform users on average by around 20 points, and it frames that difference as roughly one year of schooling. That parallel, however, needs caution: Box I.2.2 of the report itself explains that the 20 points are an approximate benchmark, built from several cycles, that varies substantially between countries — from around 10 to more than 25 points in the estimates shown — and it explicitly warns that any difference should not be mechanically converted into “years of schooling.” Moreover, here we’re talking about an observational association between groups, not a year of learning caused by using or not using AI: the viral figure circulating (“use AI well or badly and gain or lose a school year”) turns a descriptive association into a causal effect the OECD does not establish. This is exactly the kind of nuance we prefer to clarify before repeating a headline.
Why this connects with what we already argue
PISA doesn’t prove that “judgement” causes better performance. What this data does show is that frequency and declared purpose aren’t enough to sum up the relationship between AI use and performance; and the report itself offers hints that the context of critical literacy matters — that data about opportunities to critically evaluate AI-generated information, explained above.
From there, and now as an editorial position of this outlet — not as something the data proves on its own — we hold the same view we expressed about screens in the previous article: technology is neither good nor bad on its own, what matters is how, for what, and in what context it’s used. It’s the same reason why, in our own projects (EMTI Fervienza, labs.tever.es), we don’t treat AI as a shortcut that replaces the judgement of those who teach or learn, but as one more tool that demands the same care as any other.
Sources
- OECD. PISA 2025 Results (Volume I): Future-Ready Students — chapter “Student school life and beyond.” AI use items (frequency × purpose), Figure I.4.13, Box I.4.2 (opportunities to critically evaluate AI-generated information) and Figure I.4.14. https://www.oecd.org/en/publications/pisa-2025-results-volume-i_73451bc5-en/full-report/student-school-life-and-beyond_861e5904.html
- OECD. PISA 2025 Results (Volume I), general page. Source of the official comparison of ~20 points ≈ one year of schooling for specific AI-use tasks. https://www.oecd.org/en/publications/pisa-2025-results-volume-i_73451bc5-en.html
- OECD. PISA 2025 Results (Volume I) — chapter “Student performance in PISA 2025,” Box I.2.2: methodology and caveats of the ~20-point benchmark (varies between countries, should not be mechanically converted into “years of schooling”). https://www.oecd.org/en/publications/pisa-2025-results-volume-i_73451bc5-en/full-report/student-performance-in-pisa-2025_23e075c2.html
- Tever, labs.tever.es. “PISA 2025: IA y distracción digital, con datos” (independent analysis of the public microdata, 29,966 Spanish PUF records, four AI chatbot use tasks). https://labs.tever.es/blog/pisa-2025-ia-y-distraccion-en-espana